claydavenport.com
It is a new year and a new season.
First cut at 2025 projections are here. I think my pitcher projections, in particular, have had too much regression to the mean in the last couple of years; I’ve cut back on that. My validation script says they got better (for 2022-24 pitchers with at least 100 innings) than last year’s model, so fingers crossed that holds up.
Playoff chances based on those standings are over here.
And I’d like to thank Terry Thorley for pointing out to me that pages were not jumping when the menus were changed. I had noticed this behavior myself when looking things up through my phone, but had never invested the effort to find out what was going on. Turns out one of my javascripts was referencing http instead of https, and strict browsers were shutting it down. It is fixed, at least back to 1946 pages; I need to re-run pre-1946 pages , hopefully today.
In pre-season I wrote: the league leader was putting up numbers between 70-78, while the third-best mark was in the 54-64 range. My best guess right now is that by the end of 2023 we will see numbers about like that.
At the end of the year we had Ronald Acuna leading the majors with 73 (between 70-78), with Esteury Ruiz at 67 and third-place Corbin Carroll at 54 (in the 54-64 range). That held up remarkably well.
Way back when, I used to routinely run stats comparing how different run estimators performed. Been several years since I did that, so time to blow the electron dust off the code and see how things went.
Let’s start with 2023, and say: it was a good year for Equivalent Runs. Here’s how it looks straight off the window (and keep in mind, I apparently wrote the initial version of the code around 1995):
DESK /home/clayd/baseball/alltime $ eqacomp2016
AMERICAN (1) OR NATIONAL (2) LEAGUE, or BOTH (3)?
3
CALCULATE ENTIRE FILE? (1=YES, 2=NO)
2
ENTER FIRST YEAR,LAST YEAR TO WORK (i.e, 1950,1994)
2023,2023
PRINT ALL OUTPUT? (1=YES,0=NO)
1
team year r eqa woba rc bsr
COL-N 2023 721 687 686 703 693 -34 -35 -18 -28
CIN-N 2023 783 792 783 780 788 9 0 -3 5
WAS-N 2023 700 697 692 706 699 -3 -8 6 -1
ATL-N 2023 947 957 966 992 948 10 19 45 1
MIL-N 2023 728 685 692 686 687 -43 -36 -42 -41
ARI-N 2023 746 751 746 741 745 5 0 -5 -1
MIA-N 2023 668 690 701 722 694 22 33 54 26
SF_-N 2023 674 662 662 660 671 -12 -12 -14 -3
NY_-N 2023 717 723 720 714 729 6 3 -3 12
LA_-N 2023 906 889 889 877 882 -17 -17 -29 -24
PHI-N 2023 796 815 811 820 812 19 15 24 16
CHI-N 2023 819 800 795 787 796 -19 -24 -32 -23
PIT-N 2023 692 698 685 680 699 6 -7 -12 7
STL-N 2023 719 761 766 764 764 42 47 45 45
SD_-N 2023 752 769 775 757 767 17 23 5 15
NY_-A 2023 673 667 661 660 677 -6 -12 -13 4
HOU-A 2023 827 820 831 826 816 -7 4 -1 -11
BOS-A 2023 772 776 782 788 773 4 10 16 1
OAK-A 2023 585 625 613 610 629 40 28 25 44
TB_-A 2023 860 839 843 841 832 -21 -17 -19 -28
LA_-A 2023 739 753 755 755 756 14 16 16 17
SEA-A 2023 758 765 764 753 765 7 6 -5 7
BAL-A 2023 807 764 765 765 759 -43 -42 -42 -48
CHI-A 2023 641 615 602 632 626 -26 -39 -9 -15
MIN-A 2023 778 790 801 786 791 12 23 8 13
DET-A 2023 661 655 649 655 662 -6 -12 -6 1
CLE-A 2023 662 681 668 684 677 19 6 22 15
TEX-A 2023 881 872 882 876 866 -9 1 -5 -15
KC_-A 2023 676 686 665 674 682 10 -11 -2 6
TOR-A 2023 746 771 785 782 770 25 39 36 24
EQA 13352. 21.10
WOBA 15830. 22.97
WOBA-RC 15291. 22.58
RC 17446. 24.11
BaseR 13929. 21.55
OPS 18459. 24.81
TA 14917. 22.30
BA 64418. 46.34
OBA 34009. 33.67
SLG 21019. 26.47
BP_BR 13761. 21.42
LW 14704. 22.14
SilverR 16017. 23.11
XR 14123. 21.70
XRR 16179. 23.22
OPS_WRNG 18026. 24.51
MORRIS 19891. 25.75
OPI 40320. 36.66
LGE 151776. 71.13
OTS 19562. 25.54
SCA 69453. 48.12
CA 20940. 26.42
?So the first block (if I print all) gives the actual R estimate for 4 of the stats I run, with the deltas. As you can see, everybody had problems with some teams – Milwaukee, St Louis, Baltimore. The second block is the statistics I have written into the program, along with the error sum of squares and the root mean square error. Let me re-show that last part in reverse order, worst to best
| LGE | 71.13 | League average runs per PA. |
| SCA | 48.12 | Secondary Average |
| BA | 46.34 | Batting Average |
| OPI | 36.66 | I don’t remember what this is. A weird linear weight divided by outs. |
| OBA | 33.67 | Onbase average. |
| SLG | 26.47 | Slugging average |
| CA | 26.42 | Combined average (early version of EQA; 2/3 BA + 1/3 ScA) |
| MORRIS | 25.75 | Morris Exact RPG |
| OTS | 25.54 | Onbase Times Slugging |
| OPS | 24.81 | On base plus slugging (normalized seperately) |
| OPS_WRNG | 24.51 | Onbase plus slugging (normalized together) |
| RC | 24.11 | Runs Created |
| XRR | 23.22 | Furtado Extrapolated Runs, Reduced |
| SilverR | 23.11 | Silver Linear weights formula |
| WOBA | 22.97 | WOBA (book formula) |
| WOBA-RC | 22.58 | WOBA (website version with their constants) |
| TA | 22.30 | Total Average (Boswell) |
| LW | 22.14 | Linear Weights (Palmer) |
| XR | 21.70 | Extrapolated Runs (Furtado) |
| BaseR | 21.55 | BaseRuns (Smyth) |
| BP_BR | 21.42 | BaseRuns – alternate version I developed |
| EQA | 21.10 | Equivalent Runs |
I should note a couple of things. Every statistic on this list has access to the same information – AB, H, DB, TP, HR, BB, SO, SB, CS, HBP, SH, SF. And all have access to the league total of runs scored. All statistics will get the league total runs exactly right – the challenge is how to split them amongst the various teams. The typical pattern goes like this:
BA=H/AB/(LGH/LGBA) #calculate normalized variable
BARUN=(1.9*BA-.9)*PA*LGRPPA #use a simple regression equation, which varies with each stat, to get the estimate for runs per plate appearance. A couple of these use Runs per Out, rather than PA.
If someone’s formula relies on errors, they don’t get it here. If they use a different weight for BB and HBP – no. I do force those to be the same.
Lest anyone think that is a fluke, here’s the chart for 2001-2023. EQA comes in third here:
| BP_BR | 19.55 |
| XR | 19.69 |
| EQA | 19.72 |
| BaseR | 19.74 |
| SilverR | 20.30 |
| XRR | 20.30 |
| LW | 21.17 |
| WOBA | 21.21 |
| RC | 21.77 |
| WOBA-RC | 22.36 |
| TA | 22.37 |
| MORRIS | 22.93 |
| OPS_WRNG | 24.11 |
| OPS | 24.59 |
| OTS | 25.21 |
| SLG | 26.82 |
| CA | 26.97 |
| OPI | 30.74 |
| OBA | 34.01 |
| BA | 43.49 |
| SCA | 45.98 |
| LGE | 58.87 |
And then again for all of professional league history, 1871-2023:
| EQA | 22.87 |
| BP_BR | 23.05 |
| BaseR | 23.40 |
| XR | 23.44 |
| SilverR | 23.73 |
| XRR | 23.96 |
| TA | 24.30 |
| WOBA-RC | 24.51 |
| WOBA | 24.74 |
| LW | 24.85 |
| RC | 25.75 |
| MORRIS | 27.37 |
| OPS_WRNG | 28.12 |
| OPS | 28.38 |
| OTS | 29.14 |
| CA | 29.37 |
| SLG | 32.62 |
| OBA | 36.14 |
| OPI | 36.17 |
| BA | 42.39 |
| SCA | 47.87 |
| LGE | 66.83 |
This is why I keep running things with EQA. I don’t see any evidence that any other stat (other than BaseRuns, either original or my modified version) consistently even as well, much less better. And why I continually sigh over seeing such wide use of WOBA.
These are the dates when teams have first hit either a 100% or a 0% chance of making the playoffs in 2023 (according to my Playoff Odds; click on team name for their day-by-day chances). It is not the same thing as mathematically clinching or eliminated – but does represent the 1 in a million point.
Hit 100%:
Atlanta Aug 9
LA Dodgers Aug 30
Baltimore Sep 9
Hit 0%
Oakland May 24
Kansas City July 8
Colorado July 11
Chicago WS Sept 2
LA Angels Sept 6
Washington Sept 6
St Louis Sept 10
Pittsburgh Sept 12
Oakland’s elimination on May 24 – after just 50 games played – is the quickest elimination since at least 2004. But prior to 2007 I was using a different system, one that was (IMO) too rigid in its assessment of teams, so at the bare minimum we’re comparing Granny Smith to Galas. The previously fastest eliminations (since 2007) were Baltimore (63 in 2018, 64 in 2010) and Miami (65 in 2013).
Here are the spring training stats for 2023 (thorugh 3/15), compared with the (shortened) 2022 spring training totals.
In Arizona
|
Year |
AB |
H |
DB |
TP |
HR |
BB |
HBP |
SO |
SB |
CS |
|
2022 |
9626 |
2565 |
535 |
60 |
410 |
919 |
154 |
2569 |
180 |
66 |
|
2023 |
9127 |
2463 |
509 |
72 |
318 |
1040 |
139 |
2392 |
268 |
60 |
And in Florida
|
Year |
AB |
H |
DB |
TP |
HR |
BB |
HBP |
SO |
SB |
CS |
|
2022 |
8381 |
2102 |
465 |
26 |
323 |
833 |
124 |
2255 |
120 |
44 |
|
2023 |
9241 |
2342 |
503 |
48 |
330 |
1014 |
166 |
2553 |
231 |
62 |
First things first – we have a massive conflating factor called the World Baseball Classic this year, which has changed the personnel of the leagues rather dramatically. That is going to affect all of the conclusions, but for the moment we are going to pretend it is irrelevant.
The biggest change by far is the increase in stolen bases. The rule change limiting throws to first, as well as the larger bases, is resulting in far more stolen base attempts accompanied by a higher success rate. On a per-man on first basis (singles + walks + HBP):
Attempts/MO1 2022 2023
Arizona 9.34% 11.96% UP 28%
Florida 7.31% 11.09% UP 52%
Steals/MO1 2022 2023
Arizona 6.84% 9.77% UP 43%
Florida 5.35% 8.74% UP 63%
Stolen base rates haven’t been that high since 1919 (combined AL/NL numbers for 1901-2022; the last spike is spring stats 2023). The SB rate this spring is higher than the combined major league totals of the 1980s, and you literally have to go back to when Babe Ruth was still pitching to find higher numbers.
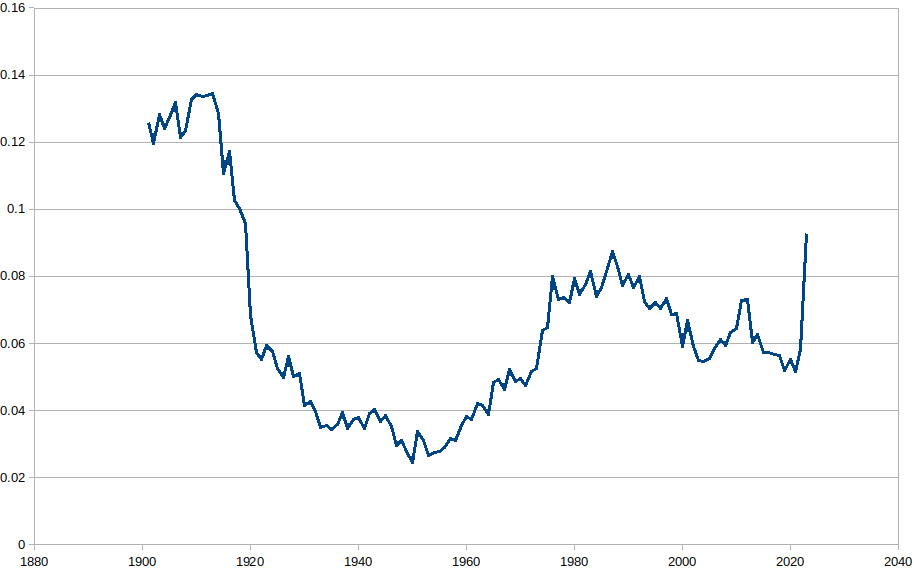
And all of this is happening with a success rate of over 80%, which is a rate unheard of in major league history (and suggests that teams aren’t running enough). I think I now consider it likely that somebody will steal over 60 bases this year. I am not sure who would do that, and I’m not sure I’d bet on a 70 just yet. But if you take a look at the early 90s – before the strike, after slide steps had cut into the stratospheric stolen base totals of the 80s – the league leader was putting up numbers between 70-78, while the third-best mark was in the 54-64 range. My best guess right now is that by the end of 2023 we will see numbers about like that.
As for the other big rule channges, it is harder to draw conclusions. Batting averages are up slightly (from .266 to .270 in Arizona, and .251 to .253 in Florida), but I’m not sure that is outside the noise window. Strikeouts (which you might think would go down, as the pitch clock gives pitchers less rest between pitches) are down slightly in the desert but up by a slightly higher amount in Florida, so a wash.
The stats projections for the 2023 season are now up. Actually they first went up around Christmas, but I’ve been doing an unusual amount of tinkering this time around. Updates should happen at least a couple of times a week between now and the start of the season – which kicks off on March 30 this year.
1. Rules changes for 2023.
Trying to figure out how the reduced shifting and the new pickoff attempt rules will affect the statistics was definitely an exercise. A lot of it, admittedly, is guesswork, but we do have the results from the minor leagues to guide us. The gist of it is I raised stolen base attempts for all players by 25% (which obviously makes a bigger difference for guys who steal 20 bases than guys who steal 2), while decreasing caught stealing rates. Left-handed hitters received improved single rates, enough to raise their batting averages by about 10 points. Switch-hitters got a bout a 7-point raise. Righties get nothing. And similar adjustments were made for pitchers, with right-handed pitchers (who face more lefties) getting a slightly larger downgrade on their BABIP.
2. Pitcher adjustments
Every year, I make adjustments made to the way I translate between the player statistics and what I expect in the next season. The changes in the pitcher numbers are somewhat larger this year. I made a mistake last year, which did not become fully obvious to me until later, in that I way over-did the regression to mean aspect. All pitchers, good, bad, or otherwise, got squeezed into a tight bin, with not nearly enough variation. I tried to avoid that trap this year.
3. Stronger adjustments for foreign leagues
There are some oddities in projecting statistics from Japan, and I took a deep dive into them this year after a disappointing performance from some more disappointments. I’ve always calculated league strength by using the results of all players who played in those leagues. I had recognized a problem with that before – that the translations between AAA and Japan gave very different results than those between the majors and Japan – but extended it this year to noting where players are from. The result of that is Japanese hitters losing about 20 points of EqA in their translation. I will try to drw that out in another post.
4. Fielding changes
A friend of mine pointed out that the fielding numbers in the translation seemed off. This was something that I think I’ve known for a while. I had built in a sort of universal fielding adjustment to handle “defense” without having to track the position closely, and it just didn’t work. So I totally overhauled the way that worked, which should lead to more consistent values.
5. New schedules
The first set of numbers I put out still had the 2022 schedule built into it. Most years that is no big deal, but this year they are changing to a more balanced schedule, with less concentration on your own division. That was good for teams in the strong Eastern divisions (the Nationals gained 0.77 wins when I changed the schedules, most of any team; the Marlins, Red Sox, and Orioles all gained over 0.5 wins). And it was bad for the AL Central (the Guardians and White Sox were the two biggest losers, dropping by 0.85 and 0.69 wins). Those changes in team totals will be accompanied by changes in individual numbers, but it isn’t large enough to be a real issue.
6. org Files with Roster Status
One of my personal favorite tools while gearing up for the season are the org dt pages. Each team is broken down by position (with pitchers grouped into Starters, Relievers, and Swing), and each player is ranked in order of their projected Major League playing time. I find it a good way to see a team’s entire depth chart – including their coming league players. And I now have it cross-referencing with MLB roster status, so you can see who is on the 40-man roster (“A”, until we get into the season), who is an NRI (“n), and who is injured (“D”, when we get that far). Here are Brewer shortstops:
    SS
  Last         First       Team Lg  Age  PA AB   R    H  2B  3B  HR RBI  BB  SO  SB  CS   BA    OBP   SLG  EqBA EqOBP EqSLG  EqA   VORP  WARP Defense FRAA  MJ BRK IMP CLP ATT DRP UPS
A Adames       Willy        MIL NL  27  597 543  81 147  28   2  28  89  53 170   7   4 0.271 0.337 0.484 0.272 0.340 0.488 0.284  43.1   5.2 140-SS   4    94  10  42  35  18   8 133
n Alvarez      Eddy         MIL NL  33  433 386  50  99  16   2  10  39  35 117   7   2 0.256 0.337 0.386 0.266 0.345 0.394 0.264  20.6   2.2 100-SS  -1    61  16  36  56  26   8  20
A Turang       Brice        MIL NL  23  625 576  69 152  25   3  10  60  49 143  22   3 0.264 0.322 0.370 0.264 0.324 0.363 0.256  25.1   3.4 147-SS   5    40  27  57  30   8   1  54
n Monasterio   Andruw       MIL NL  26  437 398  53  97  18   2   9  43  35 116   9   2 0.244 0.311 0.367 0.258 0.326 0.375 0.249  14.1   1.3 102-SS  -3    34  23  56  48  25   6  33
  Devanney     Cam          MIL NL  26  587 539  59 117  26   2  17  59  41 165   5   2 0.217 0.281 0.367 0.231 0.294 0.376 0.233  10.1   0.9 137-SS  -2    24  31  52  41  24   5  32
  Brown        Eric         MIL NL  22  305 278  33  58  14   2   6  23  22  81  19   2 0.209 0.279 0.338 0.226 0.295 0.343 0.237   6.4   0.8  71-SS   1    15  23  40  40   1   0  50
  Zamora       Freddy       MIL NL  24  231 218  20  46   6   1   3  13  10  63   6   1 0.211 0.255 0.289 0.211 0.254 0.284 0.202  -2.7  -0.4  54-SS  -1     5  64  74  27  20   1   5
  Garcia       Eduardo      MIL NL  20  541 516  52 110  22   2  13  53  20 217  12   1 0.213 0.250 0.339 0.227 0.263 0.350 0.214  -0.5  -0.3 127-SS  -2     2  43  65  30   8   4  15
  Murray       Ethan        MIL NL  23  427 393  38  79  16   2   8  35  31 137   9   2 0.201 0.265 0.313 0.215 0.279 0.315 0.214  -0.7   0.5 100-SS   5     2  28  51  37  13   2  11
  Barrios      Gregory      MIL NL  19  363 341  36  78  13   2   1  28  19  82  13   1 0.229 0.275 0.287 0.233 0.279 0.289 0.214  -0.4   0.9  85-SS   8     0  61  76  22   6   1  13
  Guilarte     Daniel       MIL NL  19  266 246  20  54   9   1   1  21  20  79   9   2 0.220 0.278 0.276 0.228 0.288 0.281 0.211  -1.0  -0.3  63-SS  -2     0  49  62  27   3   0  13
I don’t know more than anyone else when games might start being played…but I do have my first look at team projections here.
Just like last year, it looks like the Dodgers and Padres are the best two teams. The Padres collapsed, epically; the Dodgers made it to the LCS before losing to the (eventual WS champ) Braves.
My spare time isn’t what it used to be…NOAA keeps me busy. But I finally do have the new MLB pbp files parsed enough to run all the split data I need. So all of the player, league, and team should be back to having those breakdowns. Not a fan of MLB’s chosen format, although to be fair I am not using their chosen tools for reading it out. It is really, really non-linear; I think my code has to make 5 separate passes through a game to get everything it needs and arranged in a game order.
Cool graph today is the playoff picture of the AL East:
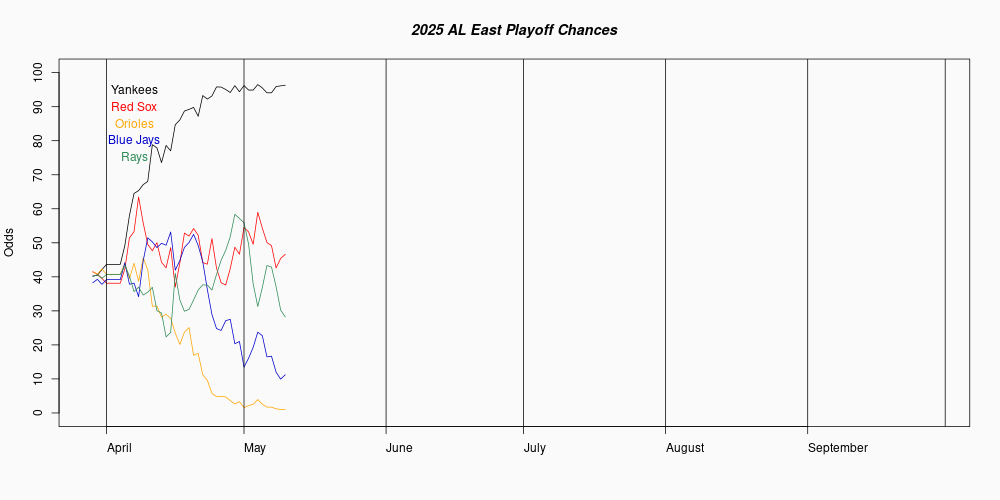
The Rays (green) remain steady at the top. The Yankee (black) line surges through their August winning streak, but has been collapsing since. The Blue Jays track (blue) over the last month is a mirror image of the Yankees, with the Red Sox (red) line running right between both of them. There is a little better than a 4-in-5 chance that both AL wild cards come from the East…two out of three teams that right now are basically even.
Also in playoff odds…the Giants this morning became the first team to make the playoffs in all 1 million runs, giving them a 100% score. The Dodgers fell just short; their 99.99995 means they finished playoff tie in 1 out of a million runs, and made the playoffs in the other 999,999 runs.
The “DTs by league” pages are not updating right now, because I can’t get the play-by-play data I use to build them from MLB. Trying to figure out what’s gone wrong in my connections. The EQA report is mostly fine – except for splits data which, once again, requires the PBP files.
