Here are the spring training stats for 2023 (thorugh 3/15), compared with the (shortened) 2022 spring training totals.
In Arizona
|
Year |
AB |
H |
DB |
TP |
HR |
BB |
HBP |
SO |
SB |
CS |
|
2022 |
9626 |
2565 |
535 |
60 |
410 |
919 |
154 |
2569 |
180 |
66 |
|
2023 |
9127 |
2463 |
509 |
72 |
318 |
1040 |
139 |
2392 |
268 |
60 |
And in Florida
|
Year |
AB |
H |
DB |
TP |
HR |
BB |
HBP |
SO |
SB |
CS |
|
2022 |
8381 |
2102 |
465 |
26 |
323 |
833 |
124 |
2255 |
120 |
44 |
|
2023 |
9241 |
2342 |
503 |
48 |
330 |
1014 |
166 |
2553 |
231 |
62 |
First things first – we have a massive conflating factor called the World Baseball Classic this year, which has changed the personnel of the leagues rather dramatically. That is going to affect all of the conclusions, but for the moment we are going to pretend it is irrelevant.
The biggest change by far is the increase in stolen bases. The rule change limiting throws to first, as well as the larger bases, is resulting in far more stolen base attempts accompanied by a higher success rate. On a per-man on first basis (singles + walks + HBP):
Attempts/MO1 2022 2023
Arizona 9.34% 11.96% UP 28%
Florida 7.31% 11.09% UP 52%
Steals/MO1 2022 2023
Arizona 6.84% 9.77% UP 43%
Florida 5.35% 8.74% UP 63%
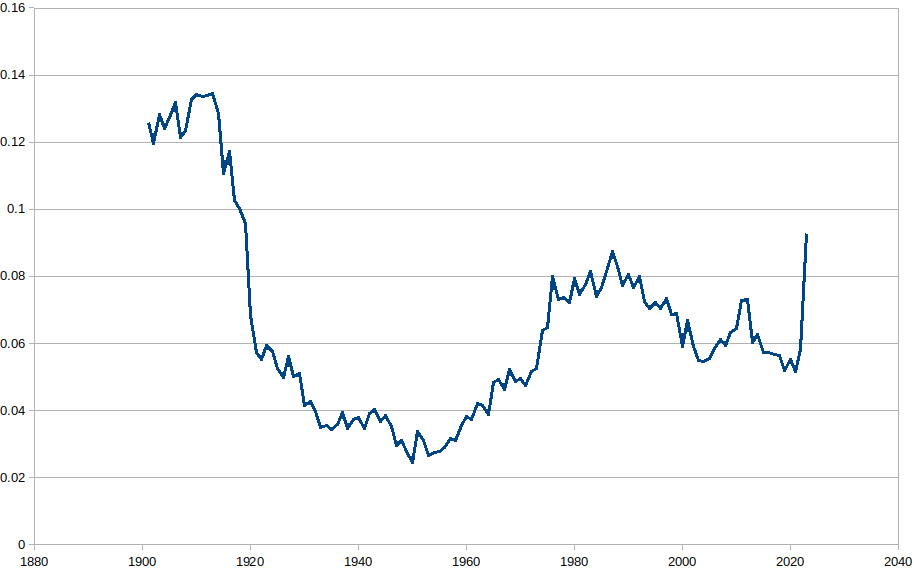
Stolen base rates haven’t been that high since 1919 (combined AL/NL numbers for 1901-2022; the last spike is spring stats 2023). The SB rate this spring is higher than the combined major league totals of the 1980s, and you literally have to go back to when Babe Ruth was still pitching to find higher numbers.

And all of this is happening with a success rate of over 80%, which is a rate unheard of in major league history (and suggests that teams aren’t running enough). I think I now consider it likely that somebody will steal over 60 bases this year. I am not sure who would do that, and I’m not sure I’d bet on a 70 just yet. But if you take a look at the early 90s – before the strike, after slide steps had cut into the stratospheric stolen base totals of the 80s – the league leader was putting up numbers between 70-78, while the third-best mark was in the 54-64 range. My best guess right now is that by the end of 2023 we will see numbers about like that.
As for the other big rule channges, it is harder to draw conclusions. Batting averages are up slightly (from .266 to .270 in Arizona, and .251 to .253 in Florida), but I’m not sure that is outside the noise window. Strikeouts (which you might think would go down, as the pitch clock gives pitchers less rest between pitches) are down slightly in the desert but up by a slightly higher amount in Florida, so a wash.