Playing the rest of the season a million times
with some help from my forecasts
by Clay Davenport
See the original version of this report, based entirely on real data (no projections).
*** Now with ** 3 ** wild cards per league ***
Generated Sun Jun 21 07:53:21 AM EDT 2026
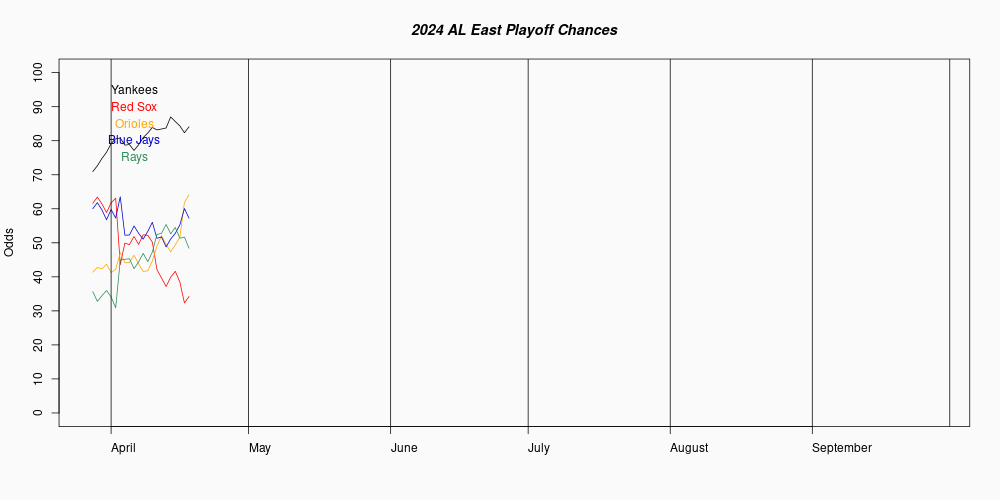
Average wins by position in AL East:  94.9 86.6 81.8 78.1 73.8
AL East           W    L    Pct3  Avg W  Avg L  Champions  Wild Card   Playoffs
Yankees           46   29   .562   94.4   67.6   86.22620   13.11730   99.34350
Rays              42   31   .501   85.6   76.4   11.11130   67.33900   78.45030
Blue Jays         38   39   .503   79.7   82.3    1.36890   34.24890   35.61780
Orioles           36   42   .513   78.5   83.5     .78560   25.46120   26.24680
Red Sox           31   43   .530   77.1   84.9     .50800   18.46330   18.97130
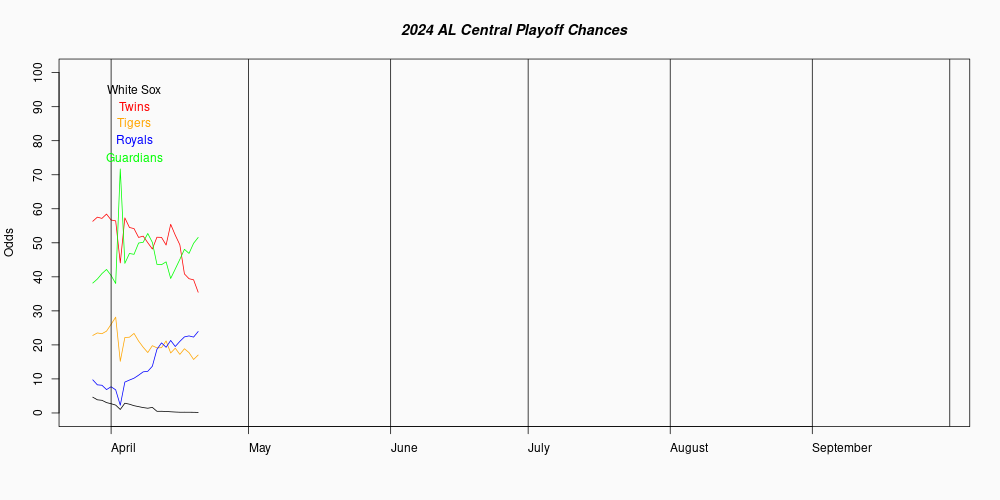
Average wins by position in AL Central:  85.4 80.9 77.7 74.6 70.4
AL Central        W    L    Pct3  Avg W  Avg L  Champions  Wild Card   Playoffs
Guardians         41   36   .485   83.0   79.0   53.69860   12.84950   66.54810
White Sox         39   36   .469   79.6   82.4   23.83680   14.03460   37.87140
Twins             37   41   .473   76.2   85.8    8.28340    7.38340   15.66680
Tigers            32   44   .529   77.3   84.7   11.85820   10.25660   22.11480
Royals            32   45   .482   72.8   89.2    2.32300    2.66650    4.98950
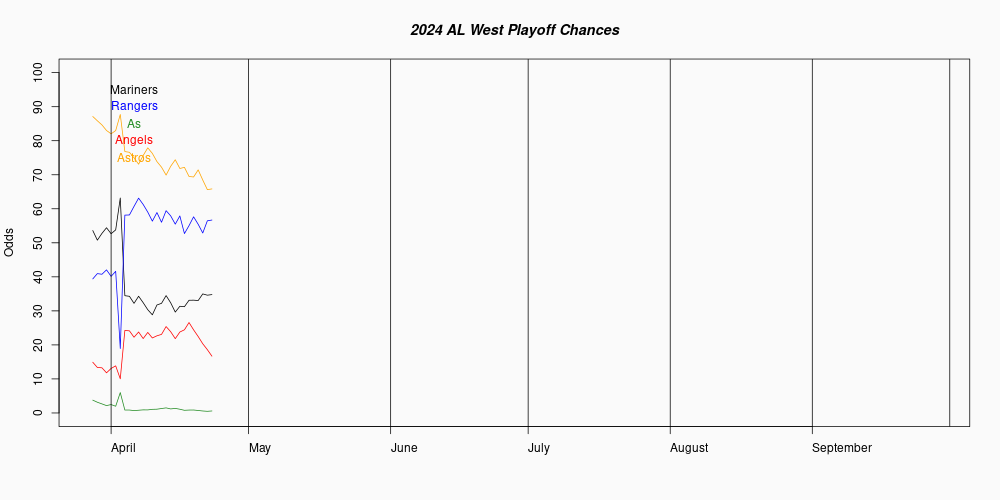
Average wins by position in AL west:  88.0 83.0 79.5 75.7 67.9
AL West           W    L    Pct3  Avg W  Avg L  Champions  Wild Card   Playoffs
Mariners          39   39   .572   86.4   75.6   64.74770   20.23740   84.98510
Athletics         38   39   .501   79.9   82.1   12.41870   25.08140   37.50010
Rangers           36   40   .504   79.2   82.8   10.15390   22.39240   32.54630
Astros            36   42   .527   80.1   81.9   12.56460   26.02450   38.58910
Angels            31   47   .459   68.4   93.6     .11510     .44400     .55910

Average wins by AL First Wild Card:  87.4
Average wins by AL Second Wild Card:  84.1
Average wins by AL Third Wild Card:  82.3
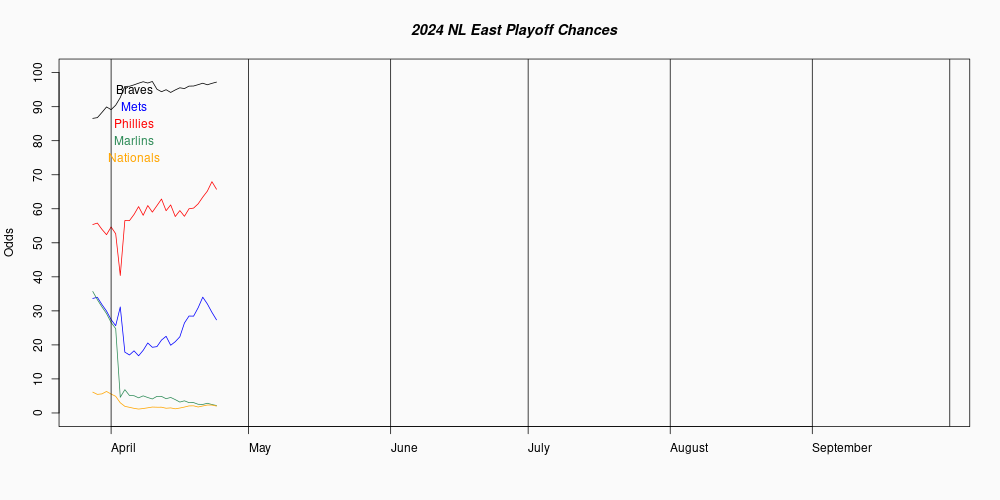
Average wins by position in NL East:  94.1 87.1 81.8 78.1 74.0
NL East           W    L    Pct3  Avg W  Avg L  Champions  Wild Card   Playoffs
Braves            48   27   .524   93.2   68.8   78.82920   18.52920   97.35840
Phillies          41   35   .544   86.8   75.2   18.02690   58.58540   76.61230
Nationals         40   37   .452   78.0   84.0     .84700   13.74320   14.59020
Marlins           39   38   .469   78.3   83.7     .92710   15.19170   16.11880
Mets              34   42   .533   78.8   83.2    1.36980   17.06030   18.43010
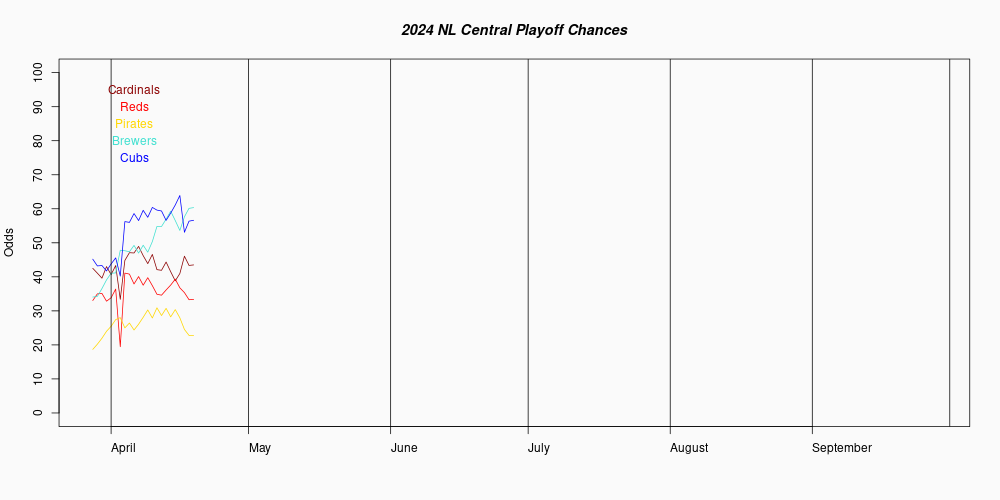
Average wins by position in NL Central:  94.9 86.2 82.3 78.8 74.1
NL Central        W    L    Pct3  Avg W  Avg L  Champions  Wild Card   Playoffs
Brewers           45   29   .572   94.6   67.4   89.15490    9.24420   98.39910
Cardinals         40   34   .488   82.2   79.8    3.81020   38.14180   41.95200
Cubs              40   37   .508   82.1   79.9    3.69130   37.22030   40.91160
Pirates           38   39   .526   81.5   80.5    2.95340   33.54240   36.49580
Reds              36   39   .480   76.1   85.9     .39020    7.76150    8.15170
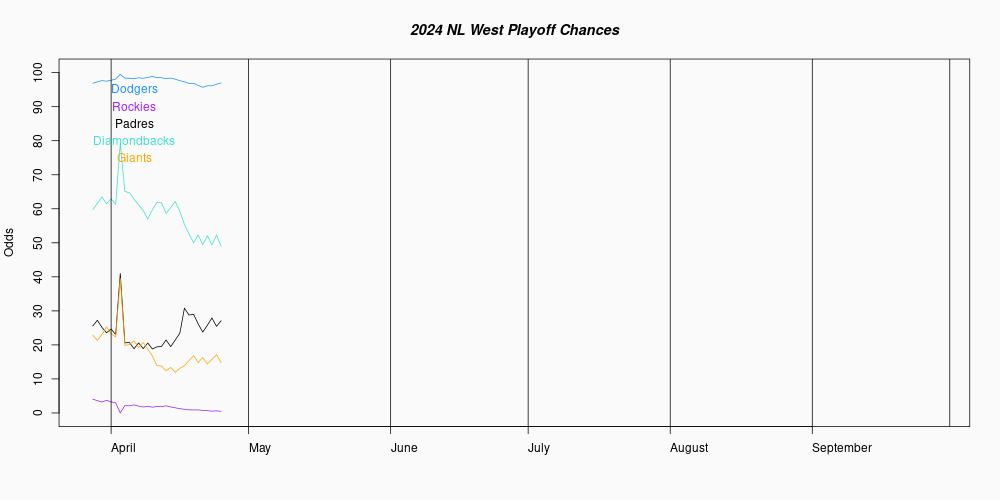
Average wins by position in NL West:  101.0 83.1 77.7 73.2 65.3
NL West           W    L    Pct3  Avg W  Avg L  Champions  Wild Card   Playoffs
Dodgers           49   28   .611  101.0   61.0   99.62360     .35080   99.97440
Padres            39   36   .444   76.7   85.3     .05040    9.51960    9.57000
Diamondbacks      39   37   .495   81.4   80.6     .31120   35.08480   35.39600
Giants            31   45   .514   75.5   86.5     .01480    5.98260    5.99740
Rockies           30   47   .424   65.8   96.2     .00000     .04220     .04220

Average wins by NL First Wild Card:  89.0
Average wins by NL Second Wild Card:  86.0
Average wins by NL Third Wild Card:  84.0
Expected winning percentages (EWP) is being driven entirely by the projections of player performance on our depth charts. The performances of every player on a team are combined to derive total team runs scored and allowed, which are averaged and normalized on a league basis, and used to calculate a won/lost record. The disadvantage of this approach is that the team's rating is entirely based on a projection of player performance. The advantage is that it can immediately respond to changes in the team's lineup, due to injury or trade. However, we still allow for uncertainty in the EWP by sampling a normal distribution centered on the EWP for each "seasonal" run. To simulate the normal 4% home-field advantage, the home team gets a .020 point bonus, while the visitors take a 0.020 penalty. The likelihood of winning each game is determined by the log5 method.
W and L are the team's wins and losses through yesterday's games.
Pct3 is the expected winning percentage, taken from W3 and L3, with the regression-to-mean component.
Avg W and Avg L are the average number of wins and losses each team finishes over the million season iterations.
Champions is how often, in percentage terms, this team won the championship of their division. Ties are not broken, but credited as 0.5 championships apiece (for a two-way tie), .333 apiece for a three-way tie, .25 for four-way, etc. This is why the final decimal place is not an error!
Wild Card is how often, in percentage terms, this team won the wild card. As with championships, ties are not broken, but apportioned among the tied teams.
Playoffs is how often, in percentage terms, the team either wins the division or the wild card.