2015 was a bad year for stats.
I had intended to write this as a review of my 2015 projections – and I will get to that – but I ran into something else while working them and decided that this was actually a bigger deal.
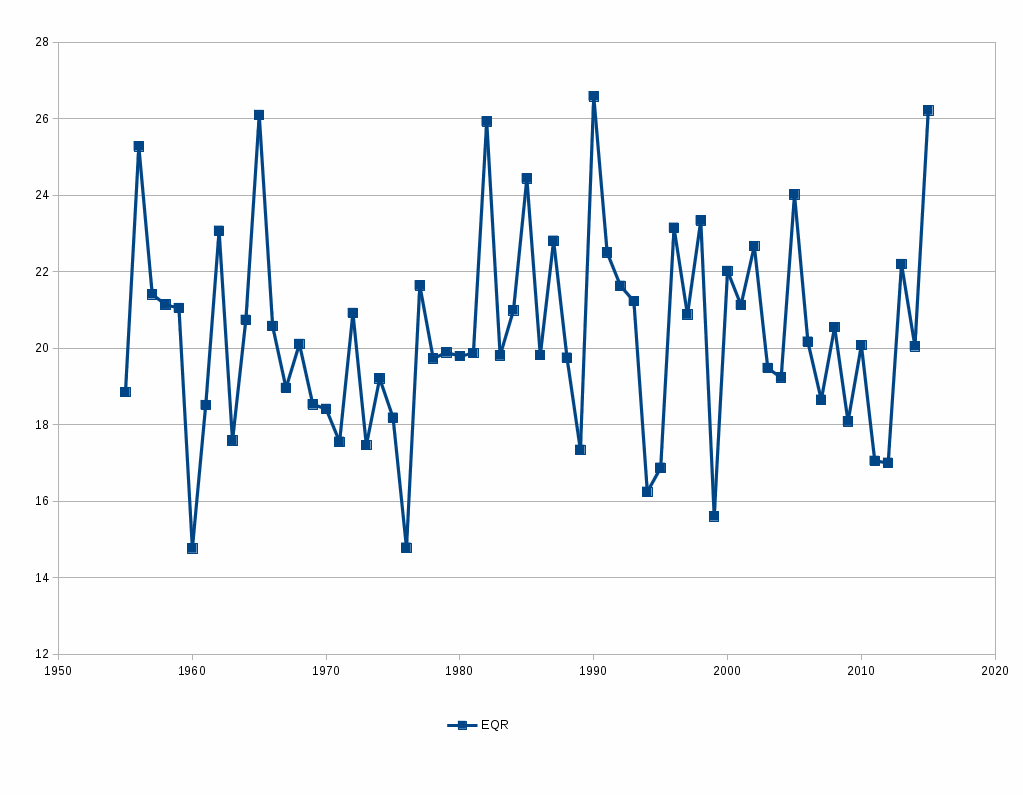
I’ve got a program here which it seems I haven’t tun in several years, judging from the last modified datestamp, which calculates the accuracy of a bunch of run estimators. Here’s the chart for my own stat, Equivalent Runs, going back to 1955:
This is the root-mean-square error for the difference between actual runs scored and Equivalent Runs, for all major league teams, by year. EqR’s average error for the entire 1955-2016 time period was 20.54 runs; the error for 2016, by contrast, was 26.22, 28% worse than normal. It was EqR’s second-worst performance in these 60 years; only 1990, with a 26.59 rmse, was worse.
One of the dirty little secrets of run estimators is that they tend to correlate better with each other than they do with actual runs scored, as they are all using variations of themes to do their estimating. And so EqR’s problem was everybody’s problem. WOBA’s estimates were 26% than their 60-year average in 2016, and also had its worst season since 1990. BaseRuns was 21% worse, worst since 1985. My own version of BaseRuns was 26% worse than average, and had its absolute worst season of the period. Total Average was 17% worse than normal, Runs Created 12% worse than normal, Palmer’s Linear Weights 16% worse, OPS 11% worse. Anyway you slice it, the relationship between statistics and runs hit a little bit of a rough patch in 2015.
But the trouble doesn’t end there. The other key tool in our sabermetric box is to convert runs scored and allowed into wins and losses. Bill James’ Pythagorean formula still stands up rather well – the only real innovation is to let the exponent vary according to runs per game; I use the Pythagenpat idea, using RPG^0.285.
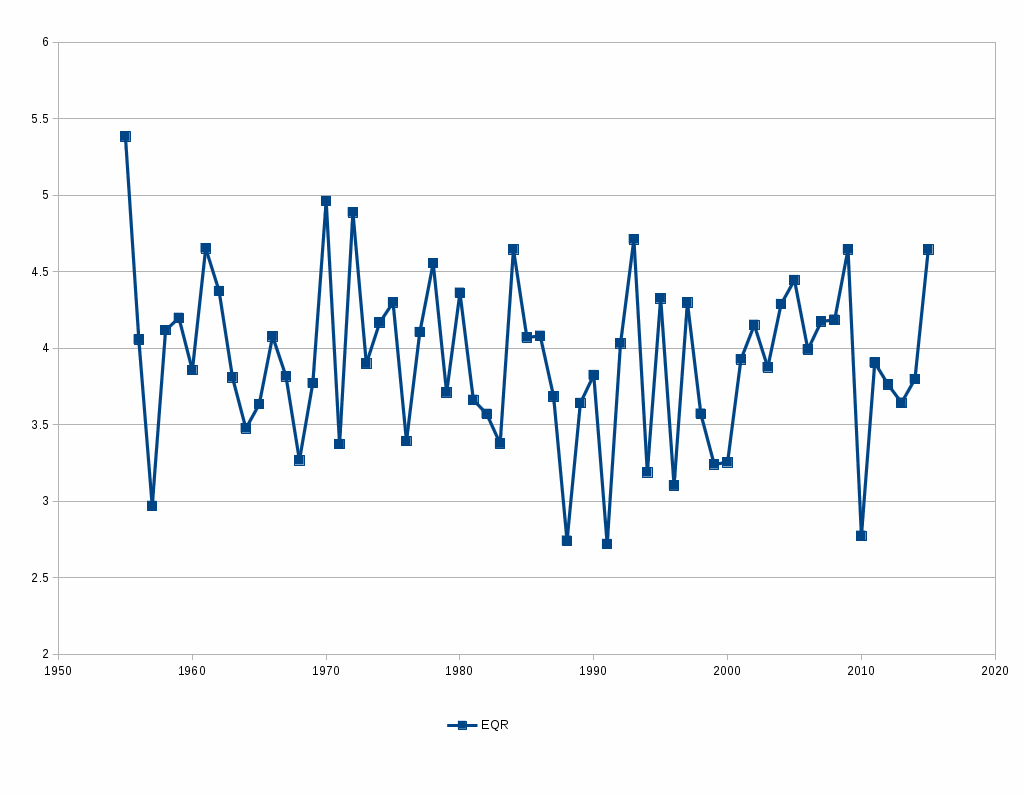
Like run estimators, the win estimator’s accuracy varies from year to year:
The 60-year average error here is 3.92 wins, but in 2016 it came in 4.65 – sixth worst over the time period. It has the appearance of a downward trend, which is almost entirely attributable to 1955 being such a bad outlier. The key contributors in 2016 were Toronto and Oakland, both of whom were more than 9 wins short of their Pythaorean expectations; meanwhile a full half-dozen teams beat their win expectation by more than 5 runs.
We can combine these two into a composite estimator. First, we need to get them onto a common scale. Normally, I would say runs, divided by 10, would get you in the neighborhood , but I am going to divide by 5 instead. I have two reasons for that:
- The ratio of the average errors, 20.54 for EqR and 3.92 for Pythagorean wins, is close to 5;
- I am using the error in runs estimation as a proxy to also stand in for the error in runs allowed estimation, which properly should be its own independent factor. For what it is worth, in 2015, the runs allowed estimates were even worse than the runs scored estimates – an RMSE of 26.8. So I am essentially doubling up on the runs and runs allowed, and then dividing by 10, which is a net of 5.
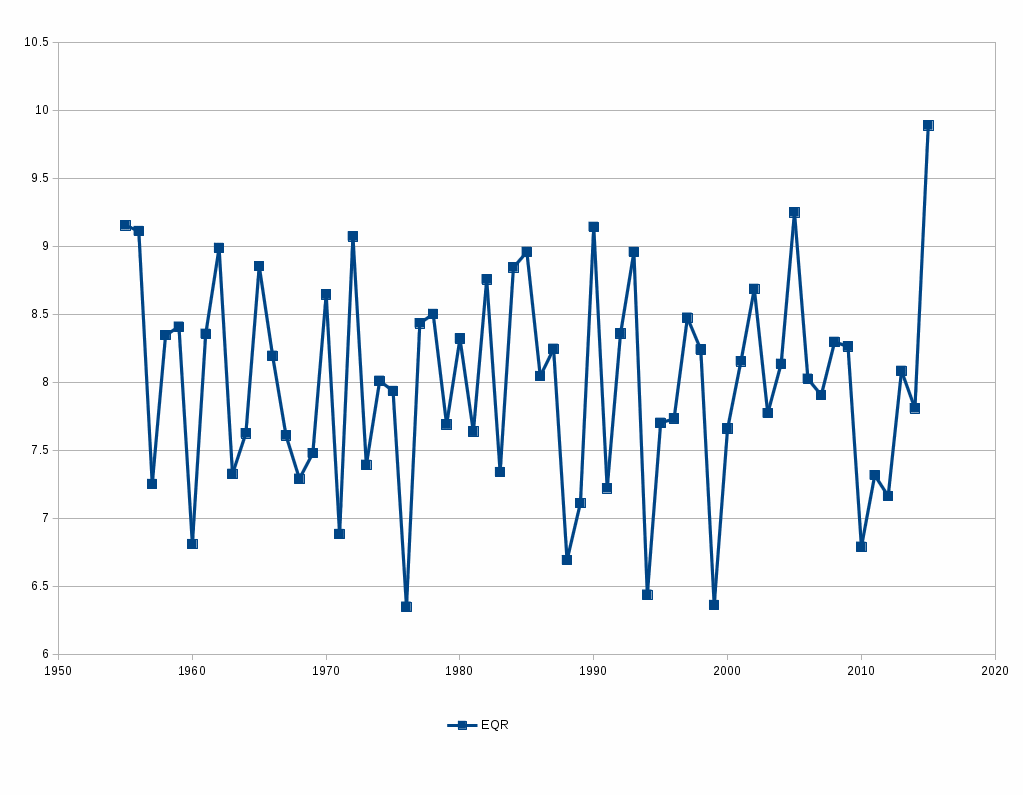
Here is that chart, then:
The combined score here is 9.89 wins, far worse than the 9.25 in 2005, which had ranked as the worst score since 1955.
Here’s the observation that got me looking into this. When I compared my pre-season projections from April 1 to reality, I found this:
– Correlation RMSE
Actual wins .334 10.11
1st-order wins .431 9.20
2nd-order wins .537 9.06
My statistical scores with reality were pretty terrible, IMO. I found it very interesting, though how much better the statistics were when I looked at first-order wins (i.e., Pythagorean wins – expected wins based on actual runs scored and allowed) and then even more so with second-order wins (calculating Pythagorean wins from expected runs scored and allowed instead of actual runs scored and allowed). I would expect that this may be commonplace, albeit less extreme – the breakdown in our stat/result relationship made those differences larger than usual.
So, in those respects, good riddance to 2015.


