Playing the rest of the season a million times
by Clay Davenport
See the Forecast-adjusted version of this report.
Generated Thu Jul 16 07:52:21 AM EDT 2026
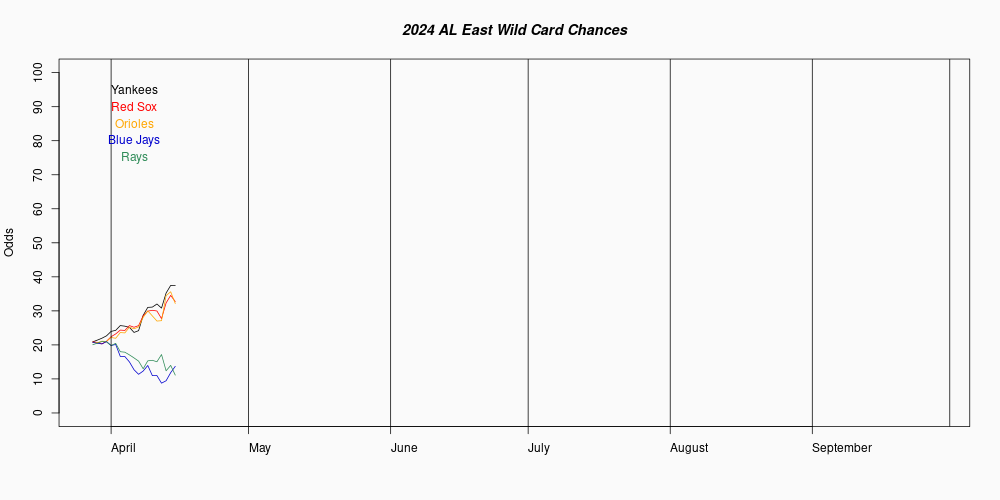
Average wins by position in AL East:  96.3 90.8 83.2 78.5 73.9
AL East           W    L    Pct3  Avg W  Avg L  Champions  Wild Card   Playoffs      1D Change 7D Change
Rays              56   38   .559   94.4   67.6   60.68760   38.62890   99.31650         .01110  -0.12700
Yankees           54   42   .576   92.4   69.6   37.82750   60.44460   98.27210         .03090   2.63620
Red Sox           46   48   .526   81.7   80.3    1.23350   46.19530   47.42880         .04650  12.60870
Orioles           46   51   .488   77.0   85.0     .10510   13.99160   14.09670         .00280   4.65780
Blue Jays         45   51   .489   77.2   84.8     .14630   16.00520   16.15150         .02070  -7.68460
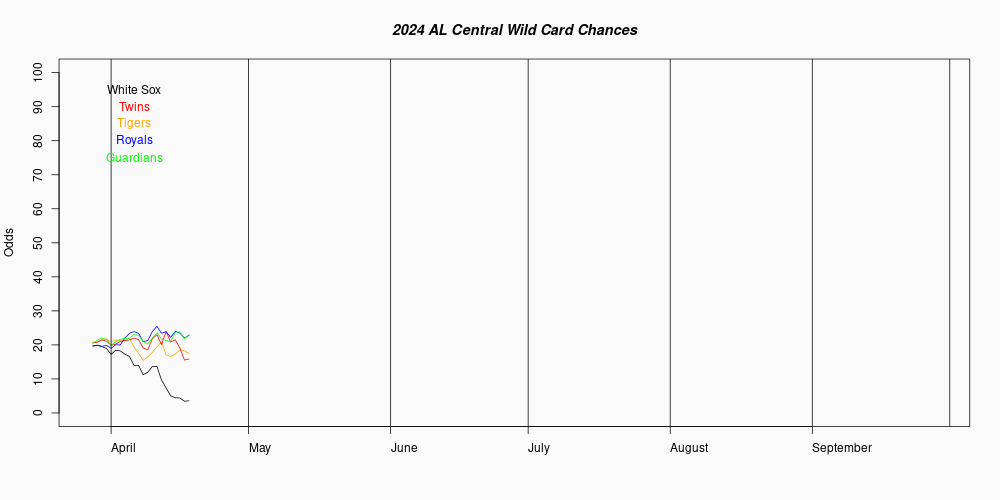
Average wins by position in AL Central:  87.5 83.4 79.9 76.0 66.6
AL Central        W    L    Pct3  Avg W  Avg L  Champions  Wild Card   Playoffs      1D Change 7D Change
Guardians         51   46   .491   84.3   77.7   42.56170   26.80840   69.37010         .02200  18.03960
White Sox         50   45   .501   83.8   78.2   37.65170   27.73260   65.38430         .03560   3.11330
Twins             48   49   .482   79.7   82.3   11.40460   19.23860   30.64320       -0.12530 -10.39350
Tigers            44   52   .525   78.9   83.1    8.36520   16.40720   24.77240       -0.02150  -6.25450
Royals            38   59   .435   66.8   95.2     .01680     .08130     .09810         .00060  -0.82380
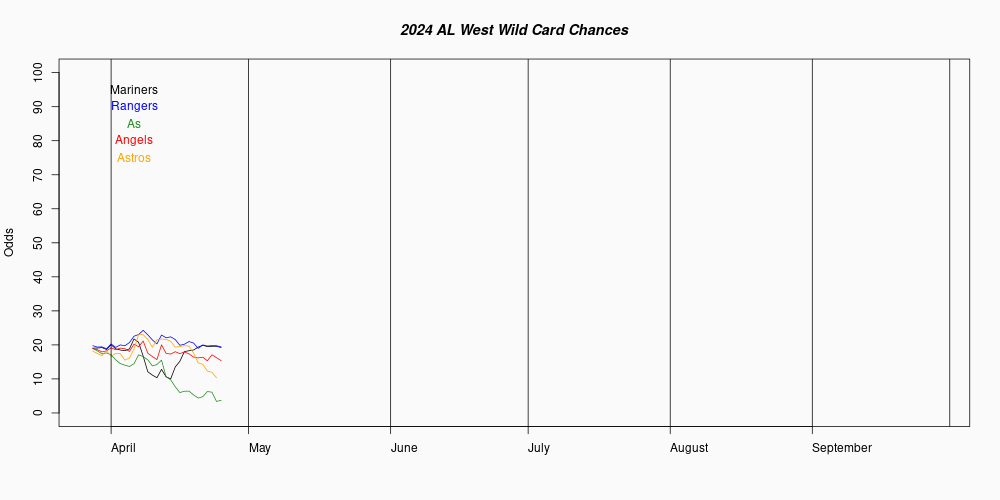
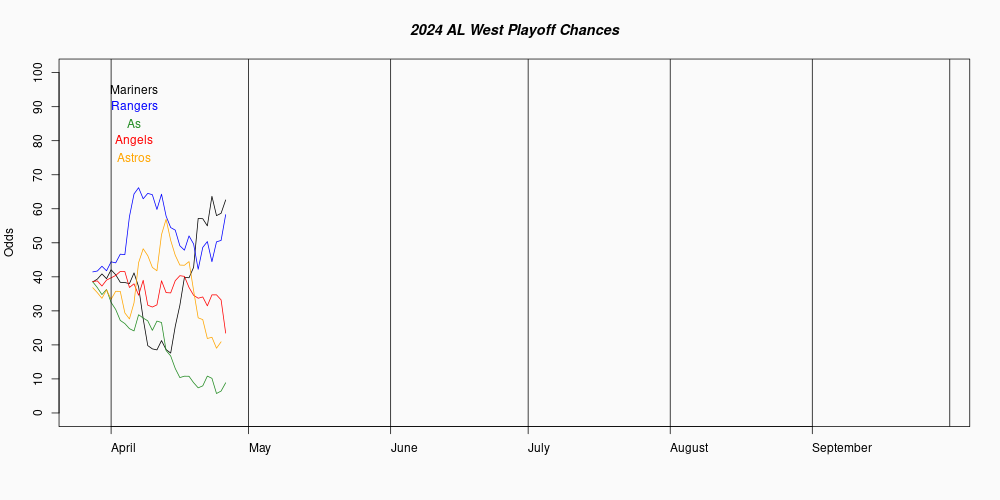
Average wins by position in AL west:  85.3 80.7 76.3 70.4 65.6
AL West           W    L    Pct3  Avg W  Avg L  Champions  Wild Card   Playoffs      1D Change 7D Change
Rangers           49   47   .502   82.6   79.4   48.79400   12.97070   61.76470       -0.01270   3.82390
Mariners          48   49   .511   81.8   80.2   41.45210   14.24940   55.70150       -0.10370 -11.12040
Astros            47   51   .455   77.1   84.9    9.14120    6.83620   15.97740         .08040  -5.48770
Athletics         41   55   .413   68.8   93.2     .38130     .28030     .66160         .00970  -2.34980
Angels            38   59   .460   67.9   94.1     .23140     .12970     .36110         .00290  -0.63820

Average wins by AL Wild Card:  91.0 85.2 84.9
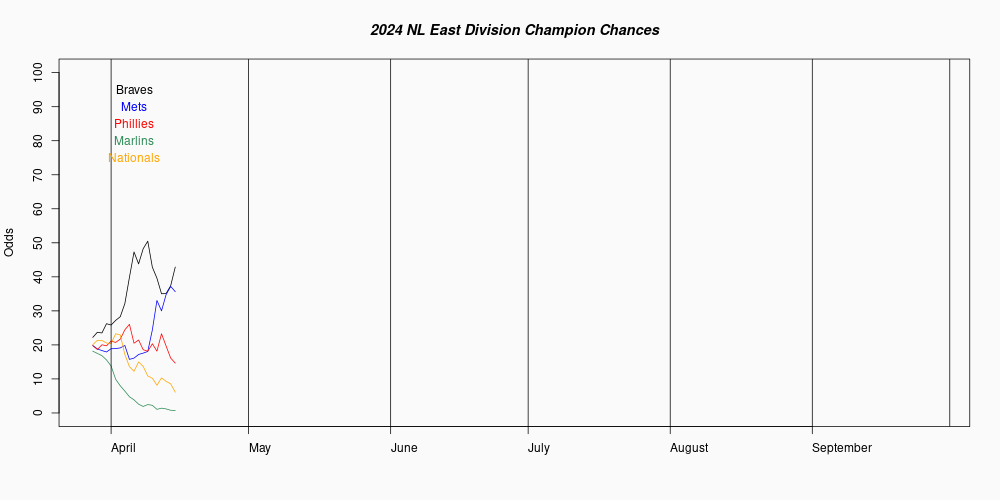
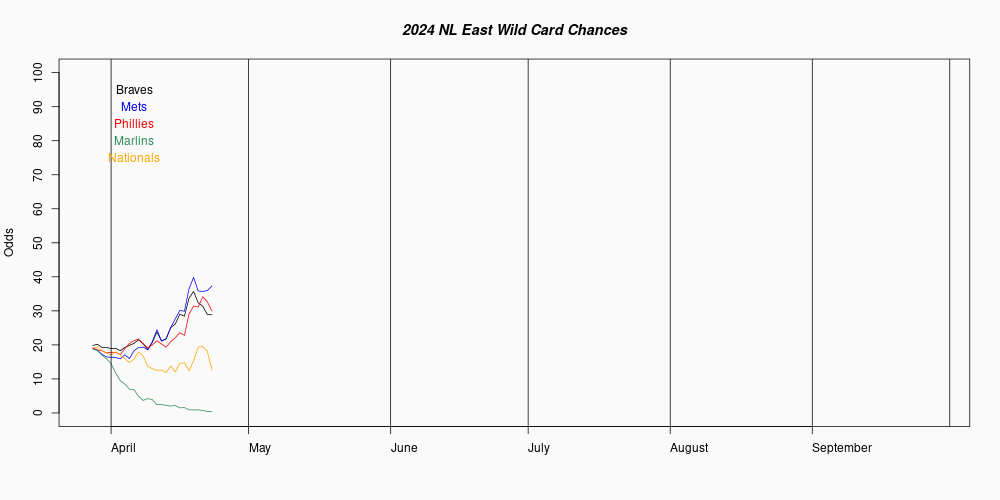
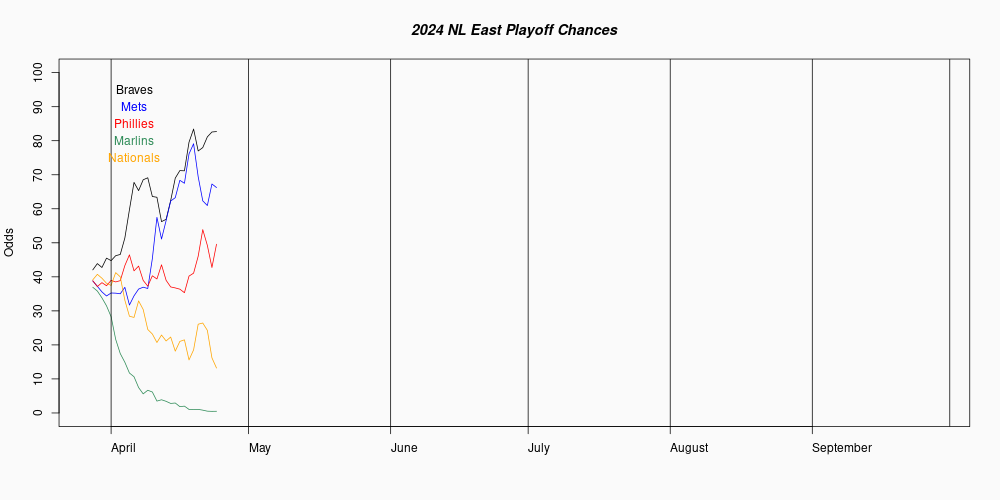
Average wins by position in NL East:  93.0 88.2 84.1 79.4 67.7
NL East           W    L    Pct3  Avg W  Avg L  Champions  Wild Card   Playoffs      1D Change 7D Change
Braves            55   40   .539   91.1   70.9   58.86930   30.72610   89.59540       -0.02100   1.38170
Phillies          54   43   .471   83.9   78.1    8.00160   31.29510   39.29670         .08460   8.25260
Marlins           52   45   .561   88.4   73.6   30.26560   45.52400   75.78960       -0.02000  -8.38181
Nationals         48   49   .503   81.2   80.8    2.86200   17.02250   19.88450       -0.04500 -10.48150
Mets              40   57   .452   67.8   94.2     .00150     .01970     .02120       -0.00030  -0.06550
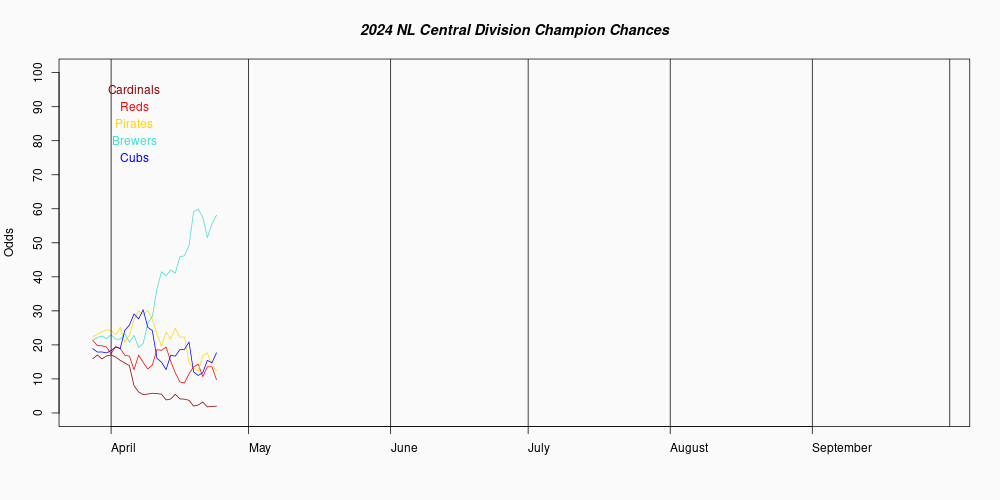
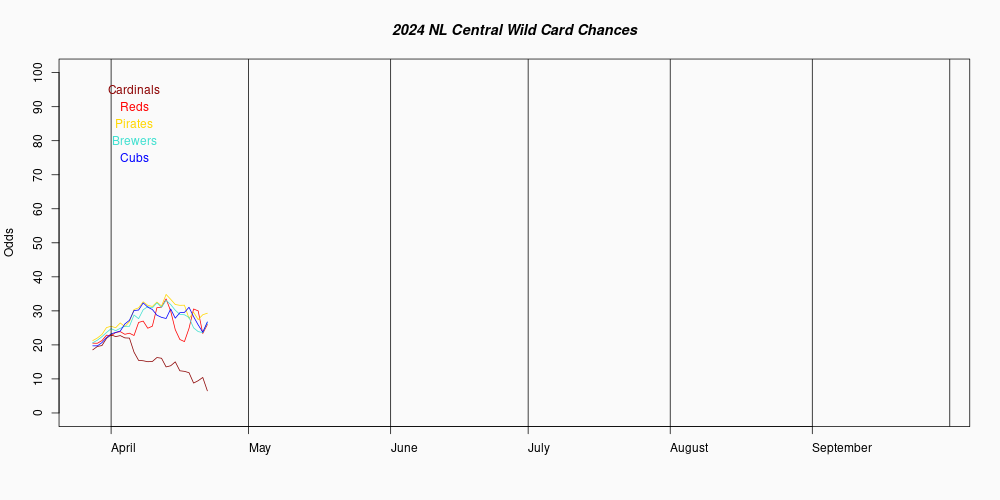
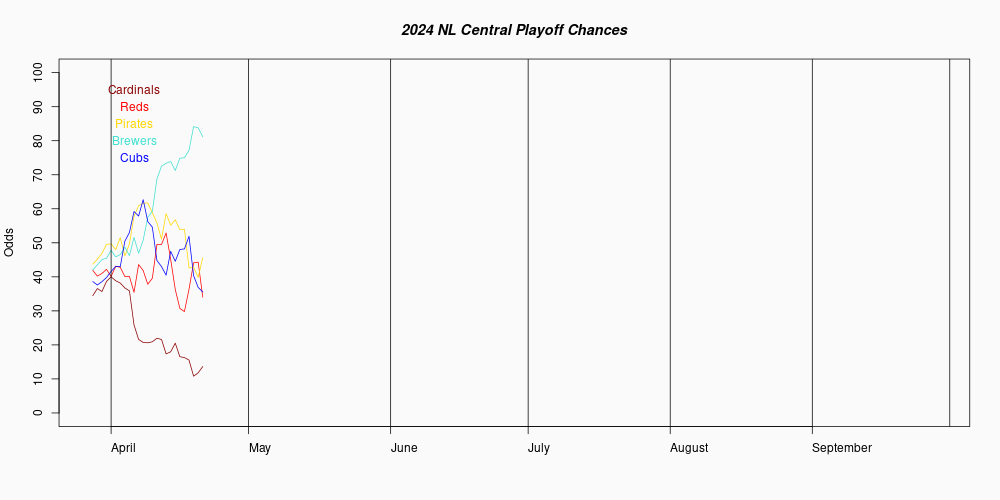
Average wins by position in NL Central:  98.9 89.4 85.1 80.8 70.6
NL Central        W    L    Pct3  Avg W  Avg L  Champions  Wild Card   Playoffs      1D Change 7D Change
Brewers           59   37   .602   98.7   63.3   92.86920    6.83180   99.70100         .00410  -0.07121
Cubs              54   42   .522   87.0   75.0    4.40820   61.45910   65.86730       -0.00880  -5.70900
Cardinals         50   45   .497   83.2   78.8     .77760   32.98820   33.76580         .04010  -4.00340
Pirates           50   47   .556   85.0   77.0    1.94460   47.20180   49.14640       -0.11480   7.78110
Reds              43   52   .435   70.8   91.2     .00040     .22690     .22730       -0.00050  -0.18360
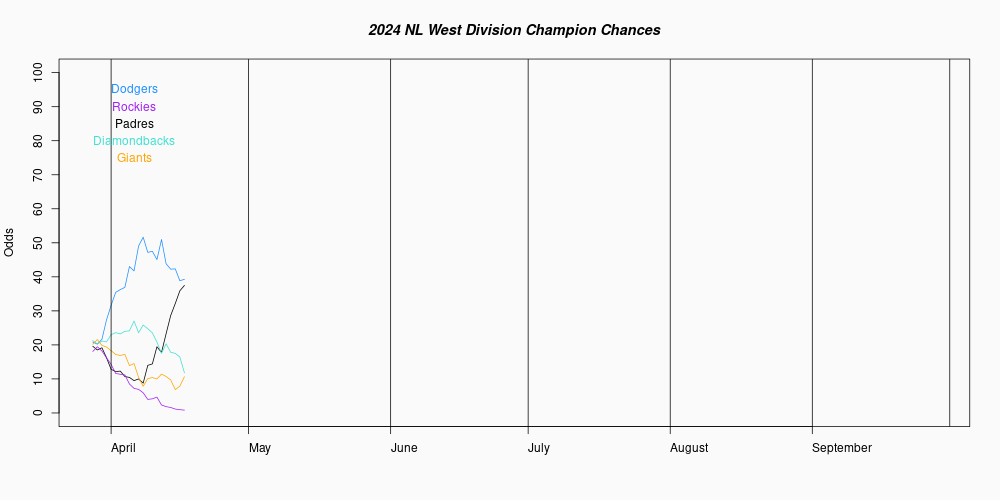
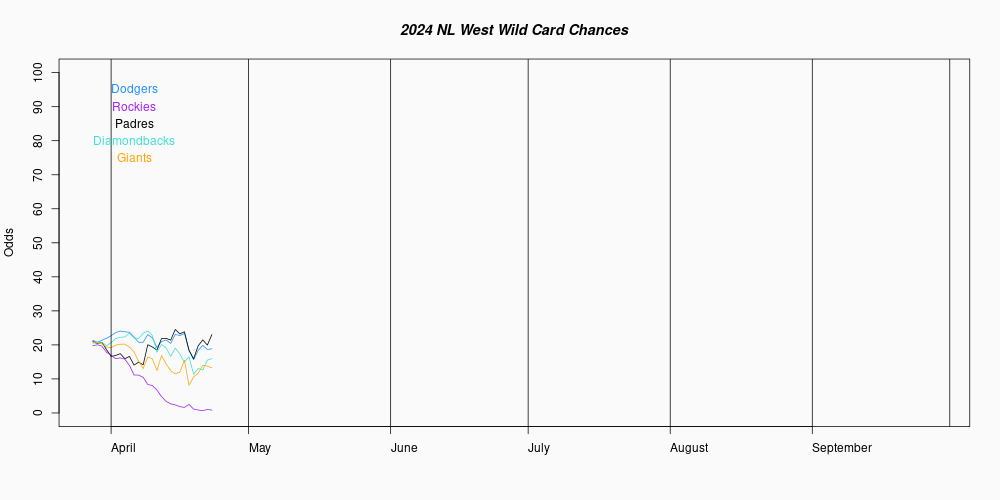
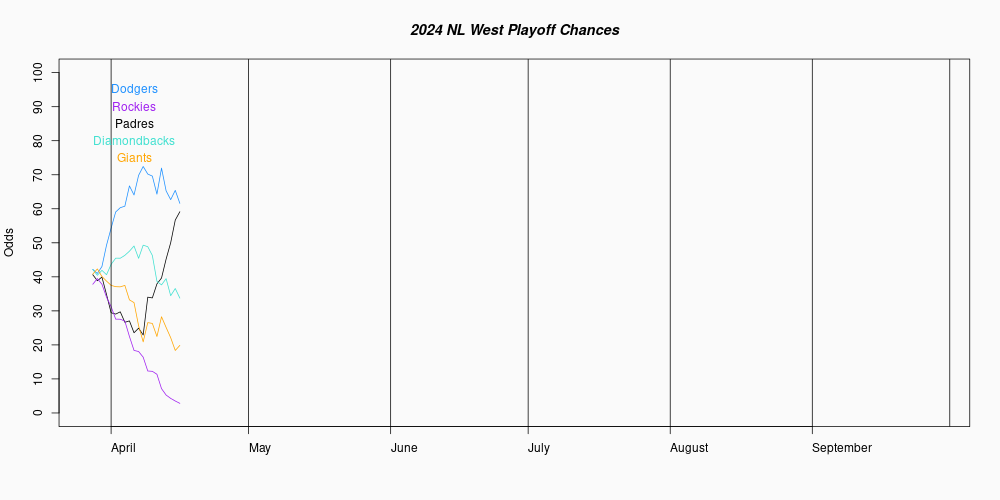
Average wins by position in NL West:  101.0 82.8 77.5 72.3 64.9
NL West           W    L    Pct3  Avg W  Avg L  Champions  Wild Card   Playoffs      1D Change 7D Change
Dodgers           61   36   .619  101.0   61.0   99.82790     .14620   99.97410         .00150  -0.02300
Diamondbacks      49   47   .478   81.3   80.7     .15370   20.04230   20.19600         .04410  13.47830
Padres            48   48   .458   77.8   84.2     .01670    5.93360    5.95030         .00580  -2.06720
Giants            41   55   .483   73.1   88.9     .00170     .58020     .58190         .02950    .10600
Rockies           39   59   .414   65.4   96.6     .00000     .00250     .00250         .00070  -0.01350

Average wins by NL Wild Card:  90.8 88.0 85.6
Expected winning percentages (EWP) for each team starts with their W3 and L3 from the Adjusted Standings. A regression is applied to derive the EWP for the rest of the season, which is going to be between the current winning percentage and .500. To allow for uncertainty in the EWP, a normal distribution centered on the EWP is randomly sampled, and that value is used for the remainder of the season in that iteration. To simulate the normal 4% home-field advantage, the home team gets a .020 point bonus, while the visitors take a 0.020 penalty. The likelihood of winning each game is determined by the log5 method. W and L are the team's wins and losses through yesterday's games.
Pct3 is the expected winning percentage, taken from W3 and L3, with the regression-to-mean component.
Avg W and Avg L are the average number of wins and losses each team finishes over the million season iterations.
Champions is how often, in percentage terms, this team won the championship of their division. Ties are not broken, but credited as 0.5 championships apiece (for a two-way tie), .333 apiece for a three-way tie, .25 for four-way, etc. This is why the final decimal place is not an error!
Wild Card is how often, in percentage terms, this team won the wild card. As with championships, ties are not broken, but apportioned among the tied teams.
Playoffs is how often, in percentage terms, the team either wins the division or the wild card.